Each month, the Cromford® Report, a regional real estate data and analytics source, releases real estate insights for the Phoenix Metro area.
Here is key data we have compiled from the August 2022 Cromford® Report for our homebuyers and homesellers:
Phoenix Metro Homebuyers
- Good news for buyers, the number of closings with seller-paid closing costs rose 27% in July compared to June equating to 7% of all closings for the month. That may not sound like much, but that’s the highest it’s been since March 2021.
- The increase is expected to continue as large cash-based investors have pulled back their acquisitions, leaving many sellers to cater to normal buyers once again.
- For most of 2021 and the first part of 2022, buyers had very little time to decide on a property before it went under contract. Last May, half of all homes that went under contract were on the market for only 7 days or less. This month homes are on the market a median of 21 days prior to an accepted contract, giving buyers more breathing room for a second showing and less pressure to make a decision on the spot
- More evidence of a growing buyer’s advantage, the percentage of properties closing over list price has declined from 58% in April to 24% August-to-date and continues to decline. The median amount over list has also declined from $20,000 to $7,000. As the current balanced market continues, expect to see this measure drop to just 10%-15% closing over list.
- Pairing all of this with the resurgence of 2/1 buydowns is making this a great market in which to buy...given you have the right negotiators and tools at your disposal.
Phoenix Metro Homesellers
- 26% of the active supply in July saw price reductions - this is an increasing trend.
- The median price reduction was $15,000 and 78% were over $5,000.
- The peak of price for 2022 so far was May, since then the median sales price has declined 6.25% from $480K to $450K. That’s an average of 2% per month* thus far, however the downward trend has not been consistent across all price ranges; a detail not reflected in the median sale price measure. To analyze the price response by sales price range, we use the sales price per square foot. In May, the peak sales price per square foot overall was $305.99, August-to-date is $289.89, a 5.3% drop averaging 1.8% per month*.
This is a similar result to the change in median sale price, but by price range the distribution looks like this:
Price Range |
May 2022 Measure | August-to-Date Measure | % Total Change since May | Average % Change per Month since May* |
| Up to $300K | $213.89 | $212.50 | -0.6% | -0.2% |
| $300K-$500K | $261.18 | $257.36 | -1.5% | -0.5% |
| $500K-$800K | $287.30 | $277.15 | -3.5% | -1.2% |
| $800K-$1M | $333.11 | $327.41 | -1.7% | -0.6% |
| $1M-$1.5M | $384.36 | $347.26 | -9.7% | -3.2% |
| Over $1.5M | $583.57 | $586.60 | +0.5% | +0.2% |
- The table shows that properties between $1M-$1.5M have seen the strongest decline since May, with an average decline of 3.2% per month. This is the only price range above the overall average decline of 1.8%.
- The runner up is the $500K-$800K with an average decline of 1.2% per month. All other price points are within 0.6% of May’s average 3 months ago as of August 9th.
- The only exception to price declines is the luxury segment over $1.5M, which is actually seeing continued, albeit slower, price increases.
*Not a calendar month
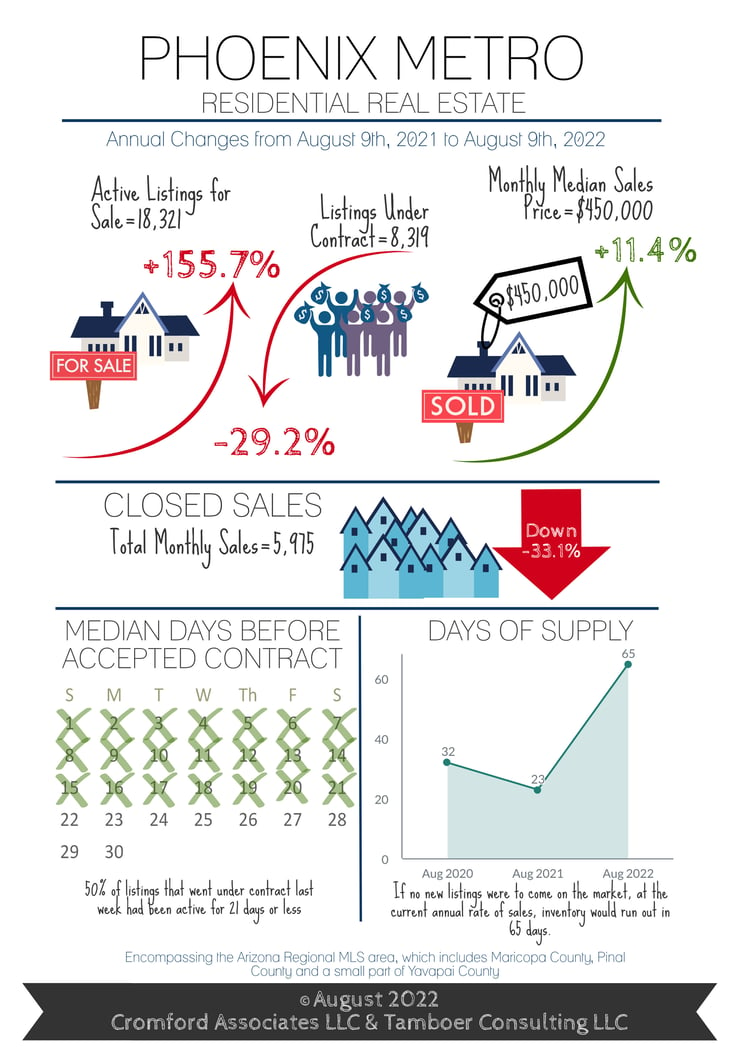
August 2022 Phoenix Metro Housing Market Infographic
About the Cromford Report
The Cromford® Report provides detailed information to track the history and current status of the Greater Phoenix residential resale market and offers unique insight into its future direction.
Updated daily and usually published online within a few hours, the Cromford Report is for anyone interested in the state of the market and how it affects their investments and livelihood. Our goal is to present data that is timely, informative and easy to understand - data not available anywhere else in this level of detail or immediacy.
The data used to create the Cromford® Report is obtained from public records and obtained under license from the Arizona Regional Multiple Listing Service, Inc (ARMLS). Cromford Associates LLC and ARMLS expressly disclaim and make no representations or warranties of any kind, whether express, implied or statutory, as to the accuracy of the data used or the merchantability or fitness for any particular purpose.
Source: CromfordReport.com